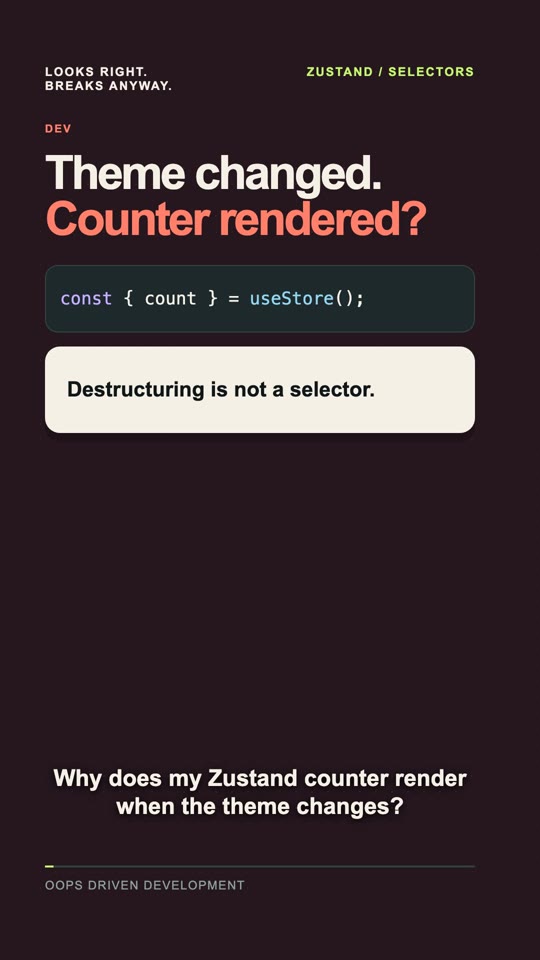
React Profiler looks fast. Why is the page still slow?
React Profiler measures subtree rendering, not the entire time from click to visible result. Expensive event-handler work can sit outside that measurement.
Use Chrome Performance and a scoped performance.measure to locate the missing time. A calculation measurement does not include later paint; compare equivalent runs and account for development overhead.
Understand it. Then fix it.
Different tools. Different questions.
React Profiler measures component rendering. Chrome Performance shows main-thread tasks, layout and paint too. Time spent in a click handler is not the same as render time.
Measure the React subtree.
Wrap the relevant subtree in Profiler. Its callback gives actualDuration: time rendering that subtree for this update. It is not the total time from click to visible result.
const report = (id, phase, ms) =>
  console.log(id, phase, ms);

<Profiler id="Grid" onRender={report}>
  <Grid />
</Profiler>
Mark the handler separately.
Mark around the expensive calculation and record the same click in Chrome. This measure covers the calculation, not the later paint. Now you can locate the missing time.
performance.mark("calc:start");
calculate();
performance.mark("calc:end");
performance.measure("calc",
  "calc:start", "calc:end"
);
Follow the longest relevant work.
If the handler dominates, optimize or move that calculation. If React rendering dominates, investigate the component tree. Compare equivalent runs; development profiling adds overhead.
Code blocks are teaching excerpts. Keep the surrounding error handling and application requirements.
Save the code excerpts ↓Read the full transcript
Why does React Profiler look fast while the page feels slow? The chart says everything is fine. The mouse disagrees. React Profiler measures component rendering. Chrome Performance shows main-thread tasks, layout and paint too. Time spent in a click handler is not the same as render time. Wrap the relevant subtree in Profiler. Its callback gives actualDuration: time rendering that subtree for this update. It is not the total time from click to visible result. Mark around the expensive calculation and record the same click in Chrome. This measure covers the calculation, not the later paint. Now you can locate the missing time. If the handler dominates, optimize or move that calculation. If React rendering dominates, investigate the component tree. Compare equivalent runs; development profiling adds overhead. The chart cleared React. The expensive function has requested legal representation.